

🚀 PROCESS
A variation of the ARIES* framework (below) was employed for systems architecting in a way that would develop an enterprise structure that would be more likely to produce qualitative, human-centric research, data, and sharing infrastructures. The framework was adjusted from the original presented below, reversing the steps of "stakeholder analysis" and "capturing current architecture."
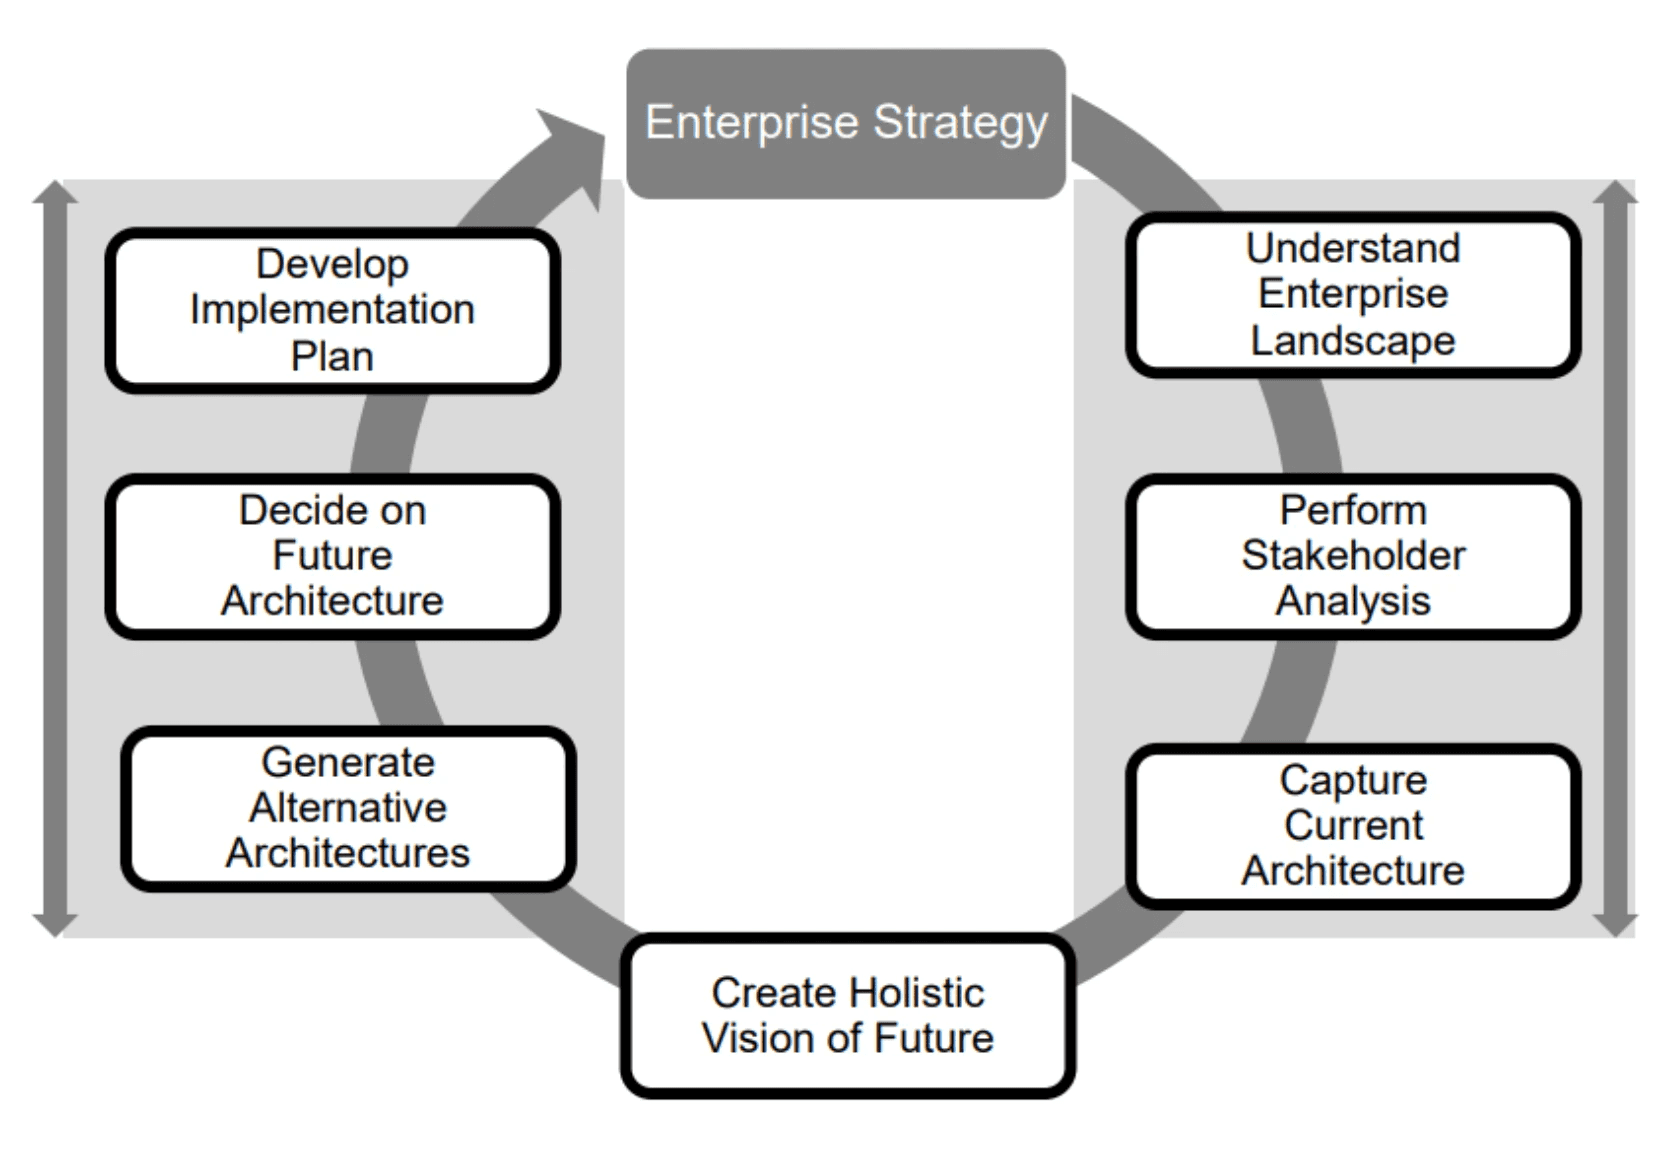
While normally I would be an advocate for early-stage user-research, this particular project was aiming to design a system for a massive range of people (every public elementary and secondary student in America), and a better understanding of the enterprise was necessary to frame stakeholders in categories that could be designed for within that system. To do this:
Extensive background research on the current enterprise was performed, analyzing organizational structure, mission, history, and problem definition, with results summarized in this document.
A mix of systems analysis methods were employed to break-down the enterprise, map influence, drivers, checks and balances, and value-flow through the system.
The place of various stakeholders within that system, and their relationship to the end goal of local ideation, were analyzed, mapped, and plotted in relation to one-another.
Values, experiences, and motivations for each of those selected stakeholders were analyzed and their level of power, legitimacy, and urgency in the enterprise transformation were determined.
A future vision of the enterprise was formulated, given the potential for localized problem-solving and targeted information-sharing.
A number of concepts were ideated, with 6 shared here in comparison to the current enterprise structure.
Insights gained from the stakeholder analysis and background enterprise research were used to direct the design process in refining the ultimate concept before developing an example scenario vignette of operations, future-proofing, and potential implementation plan.
PHASE 1 🌎 DEFINING THE SYSTEM ARCHITECTURE
I began by mapping out and analyzing the existing architecture, from the low-level org chart, to the departemnt's position in the federal government.
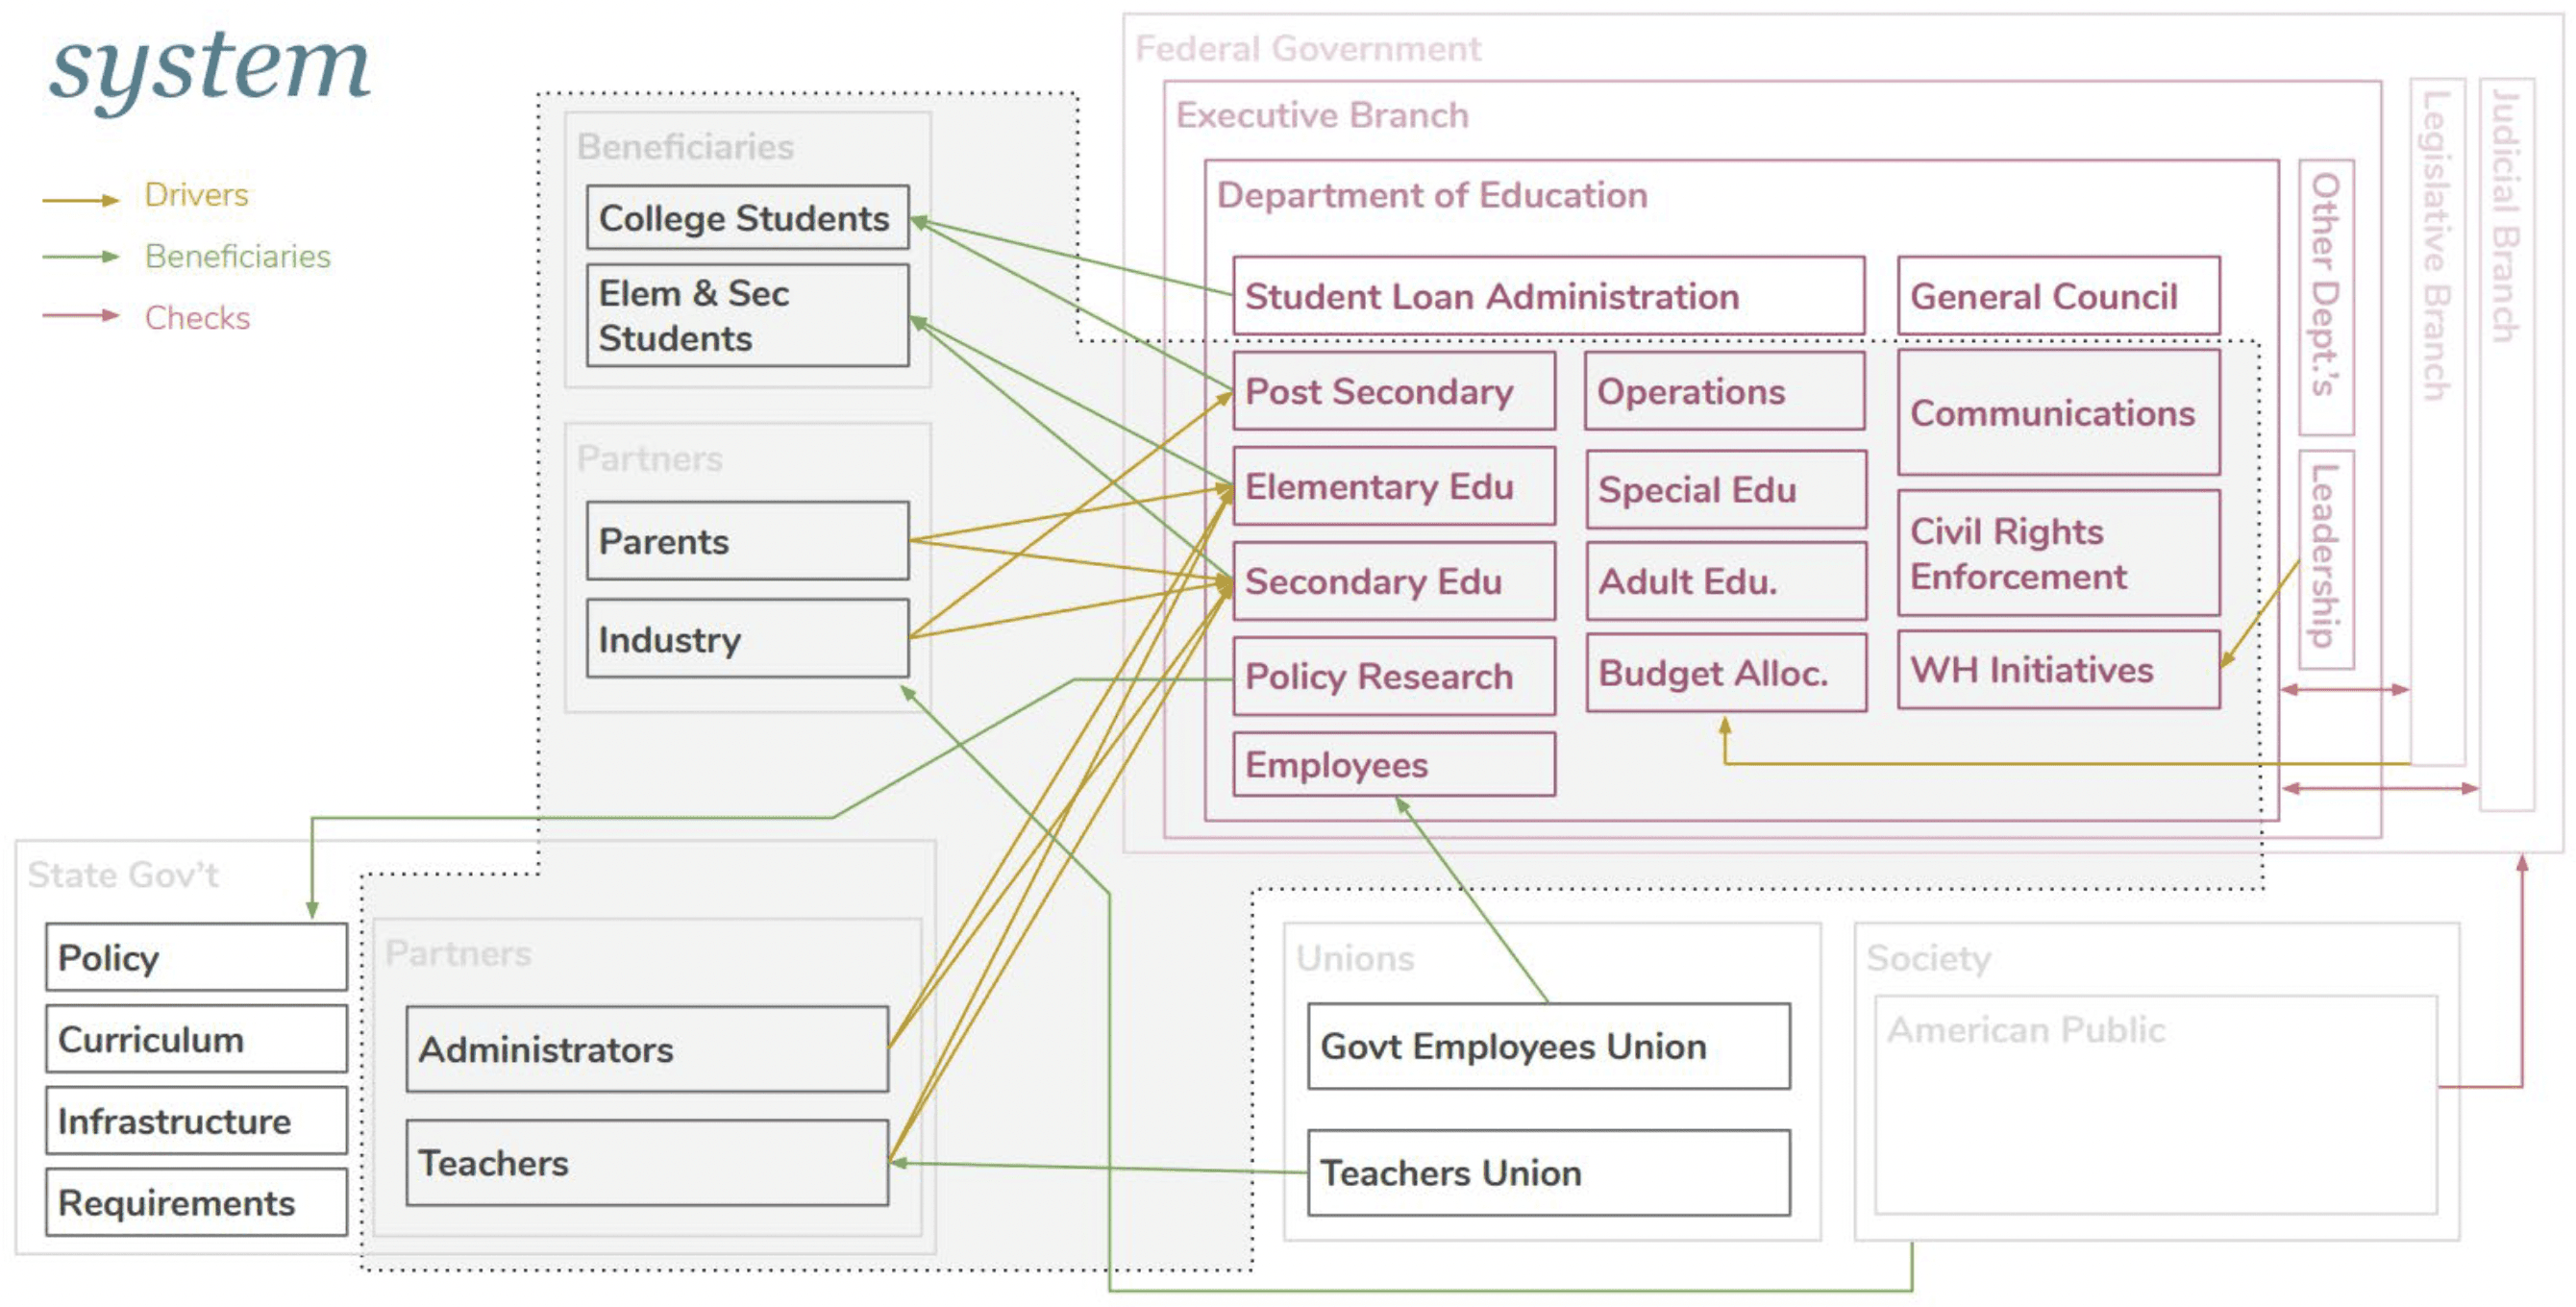
FIGURE 2.1.1
System boundaries with mappings for drivers, beneficiaries, and sources for checks and balances. Synthesized by the author based on background research.
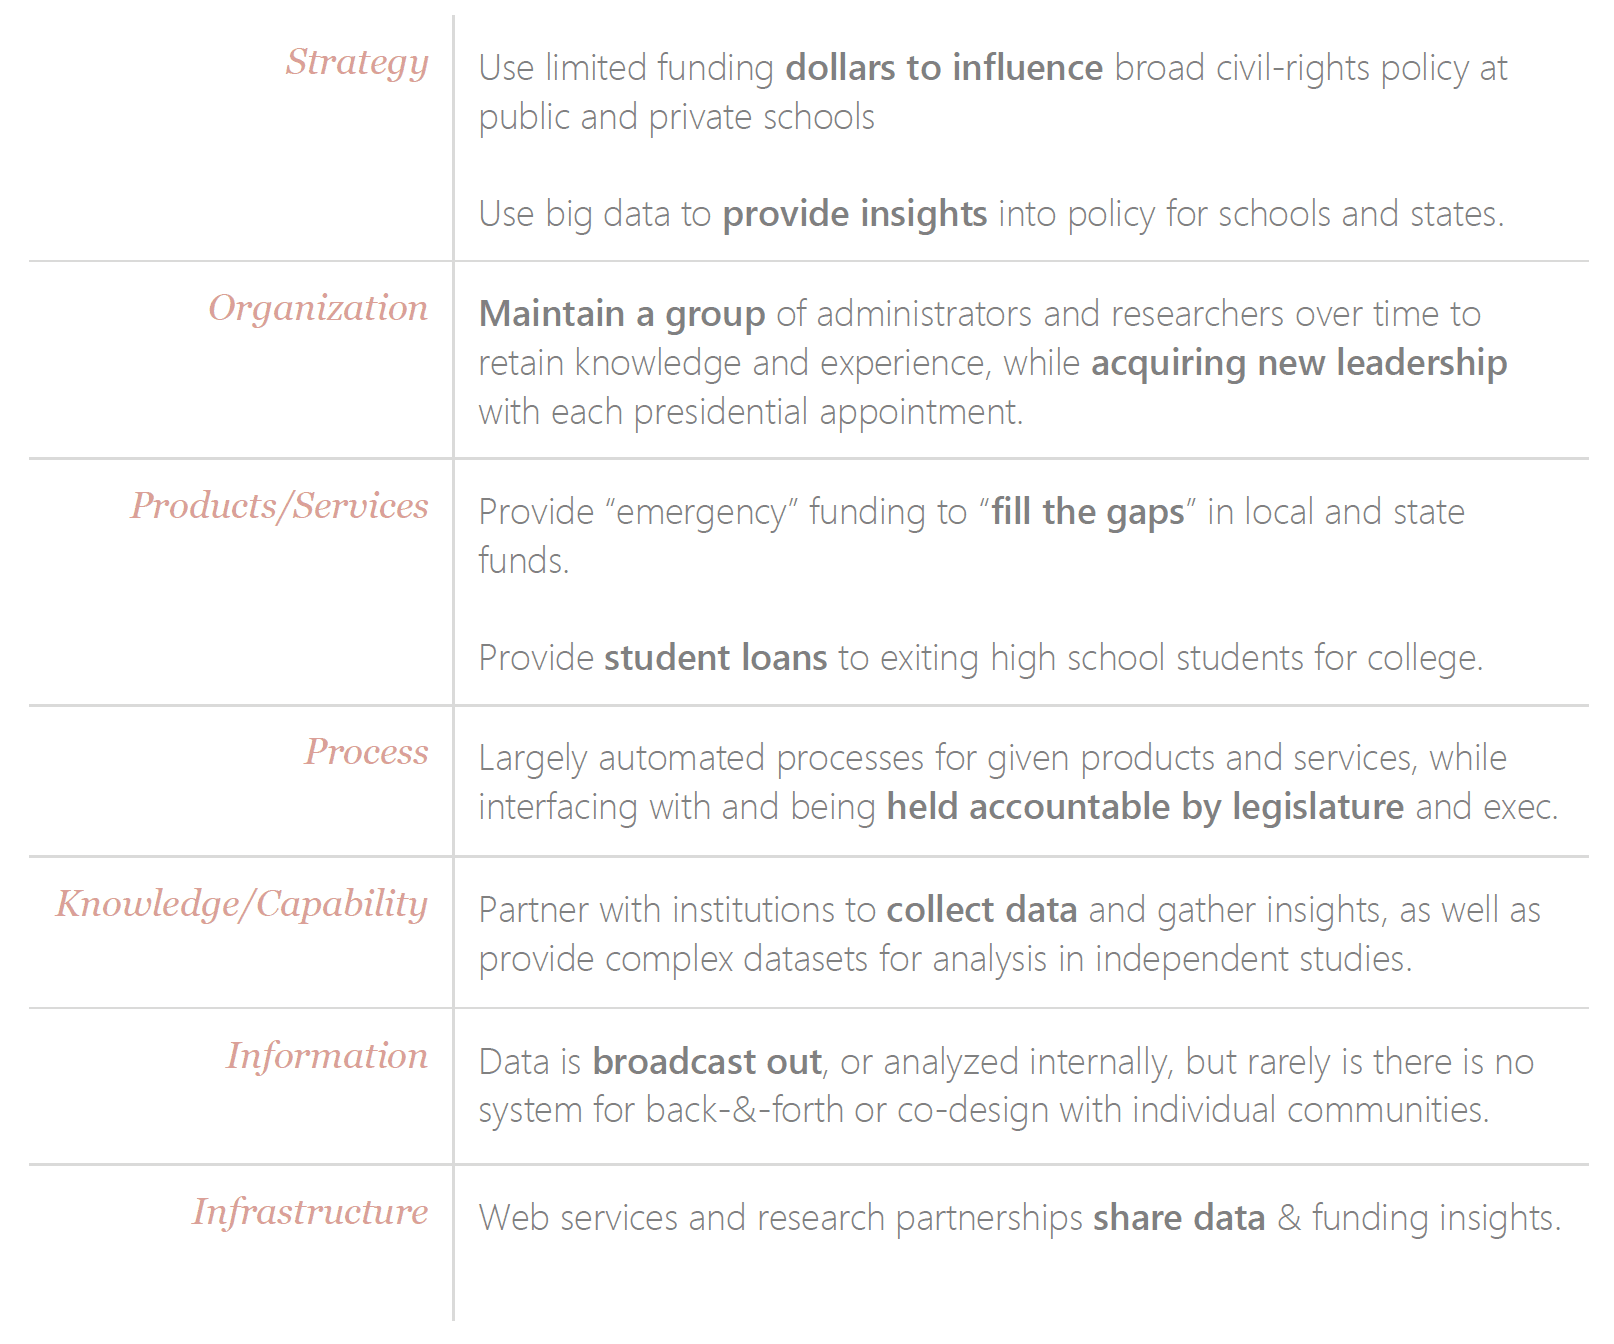
FIGURE 2.2.2
A look at the current system through the lens of 8 system view elements
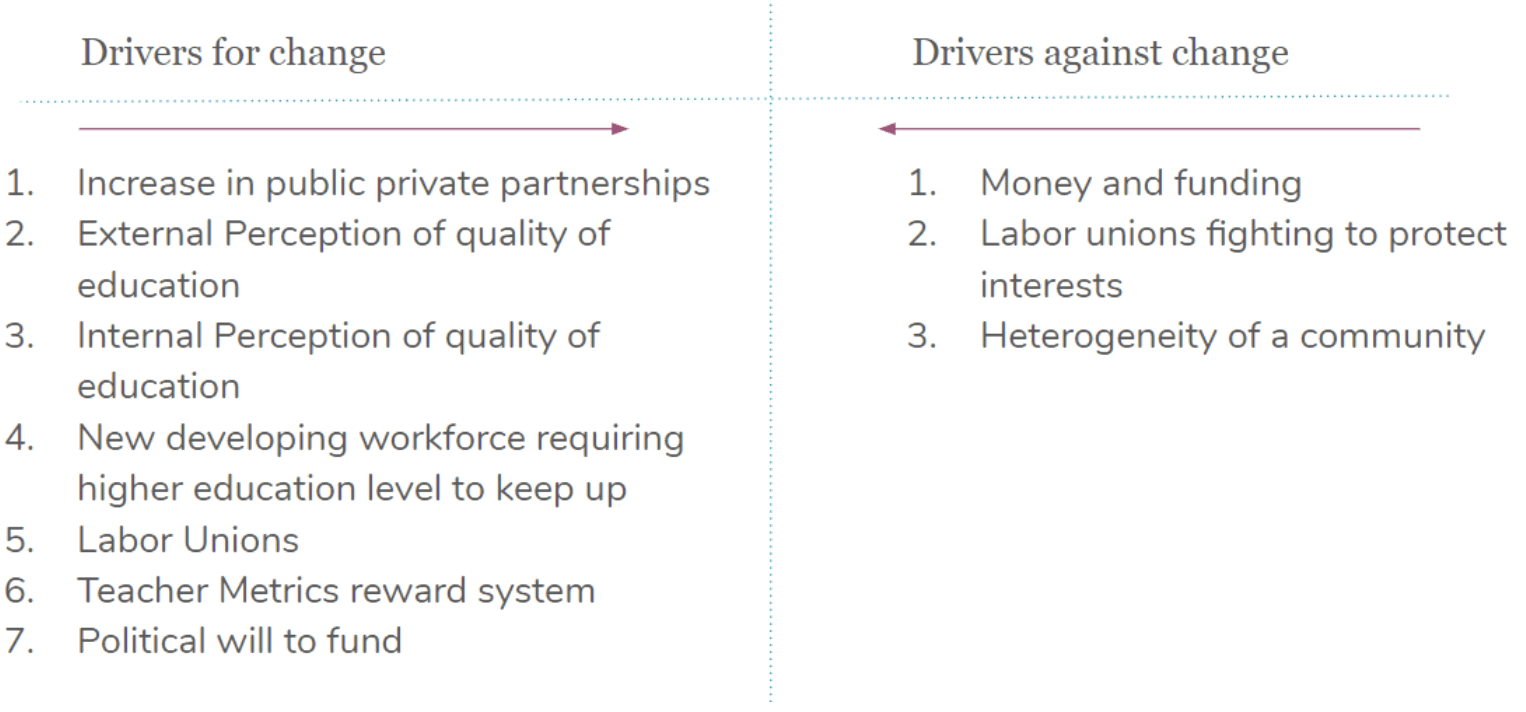
FIGURE 2.2.2
Force Field Analysis | Drivers for and against change within and outside of the enterprise
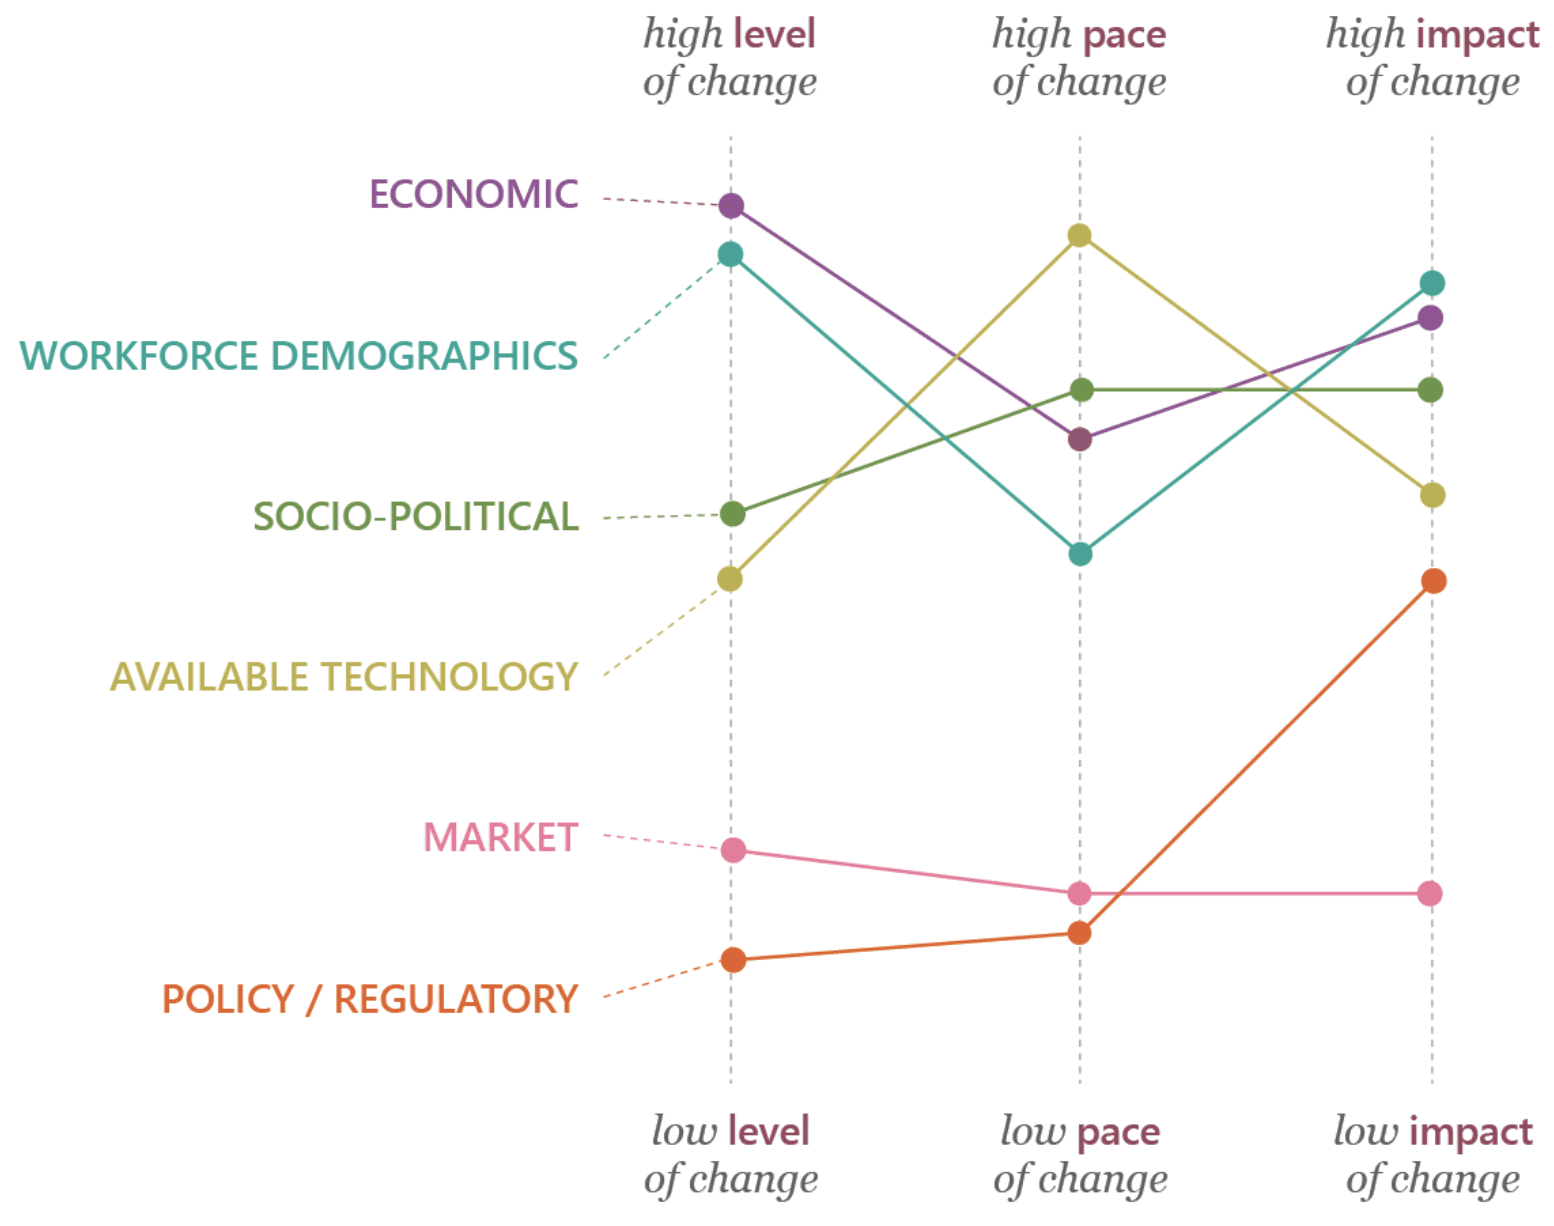
FIGURE 2.2.3
Outside forces and their relative impacts on change within the current organization. Points are notional – based on information presented in the architecture section. Outside forces can be unpredictable, but generally-speaking behave with trends like these when meeting at the interfaces of the system.
QUOTE FROM ED.GOV
While its mission is a worthy one, the department doesn't actually have the constitutional power to set or enforce policies
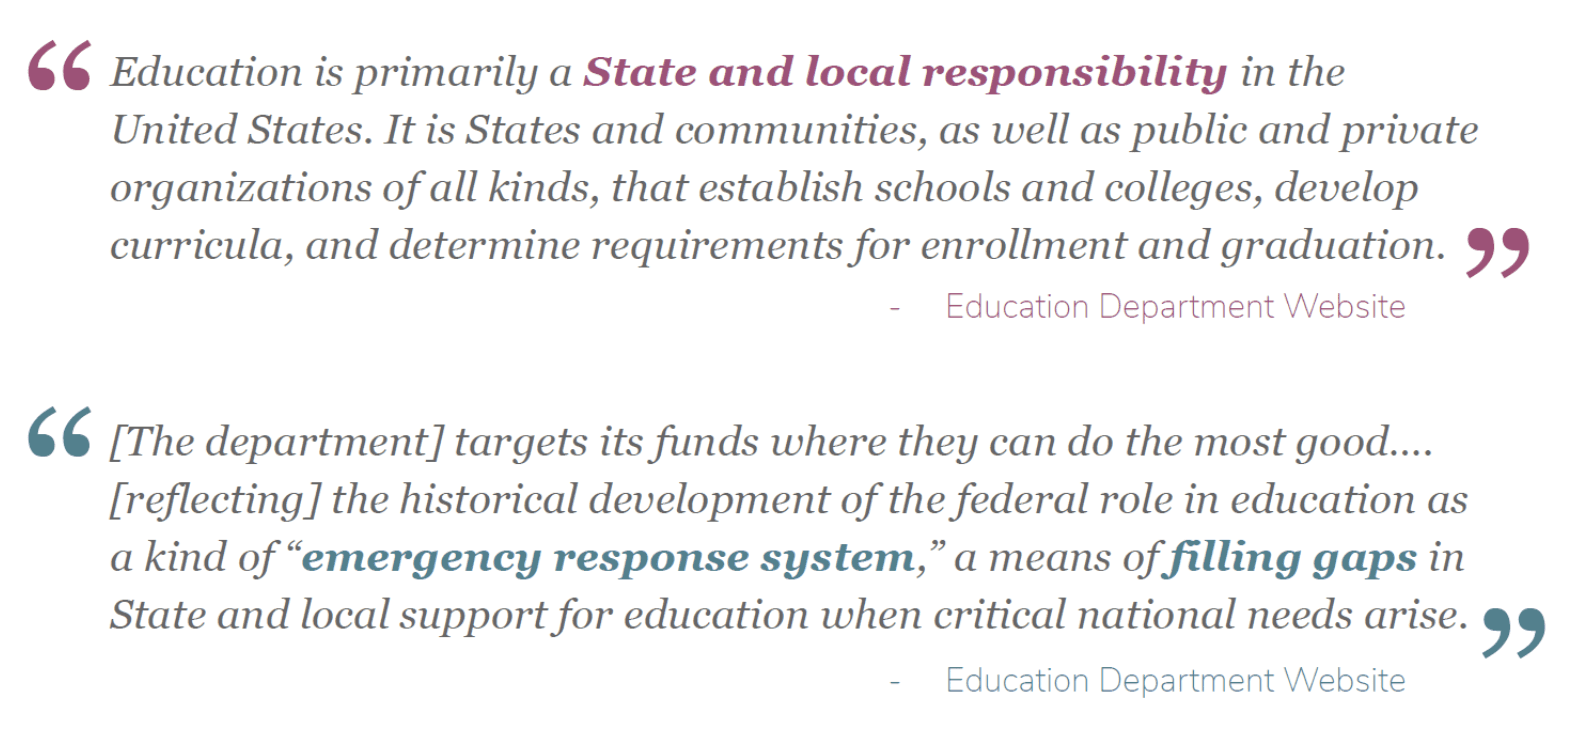
QUOTE FROM ED.GOV
What the organization can do is utilize it's $645B budget to enforce standards and practices in schools: civil rights policies, for instance.
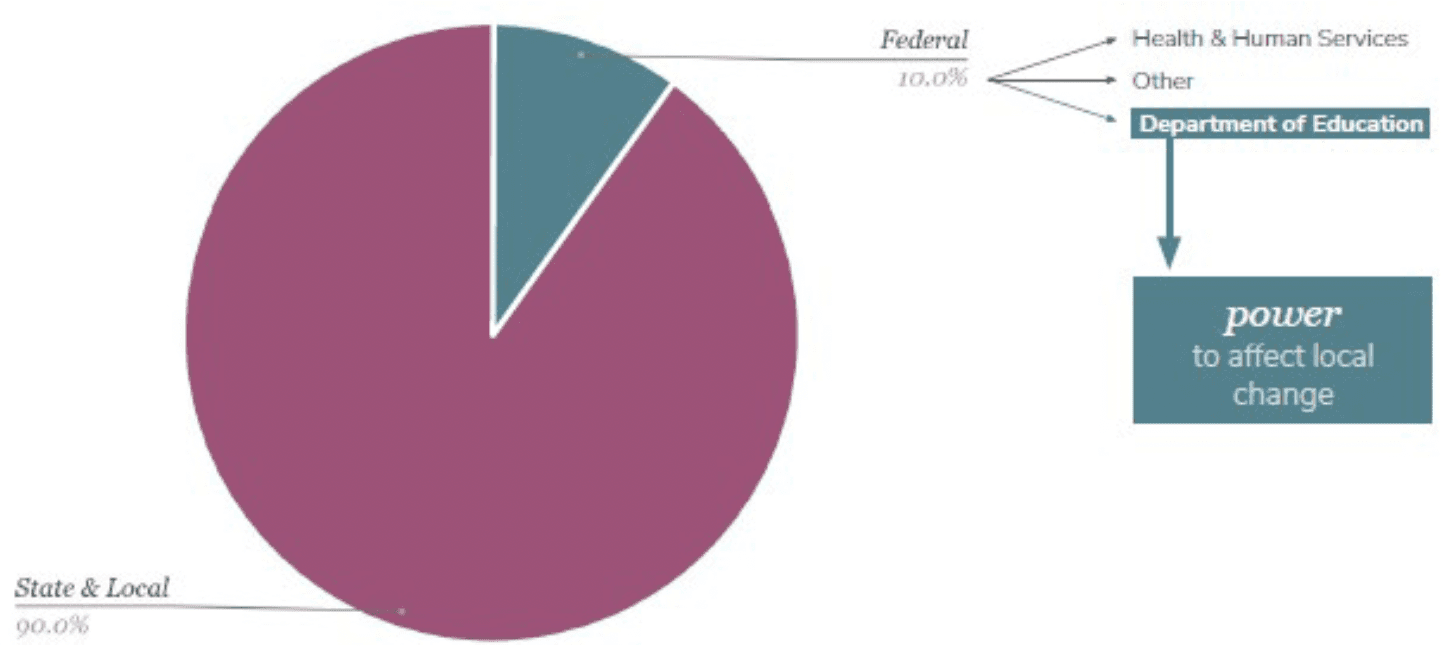
FIGURE 3.1.2
The Department of Education leverages its conditional “gap-fill” funding to mandate certain powers in local school systems.

FIGURE 3.2.1
High-level organizational chart for the United States Department of Education (2019), with R and D highlighted by author to indicate the equivalent of Research & Development organizations common in private industry.
PHASE 2 👥 STAKEHOLDER ANALYSIS
Analysis of United States k-12 stakeholders began by researching needs and values of key entities, both internal and external.
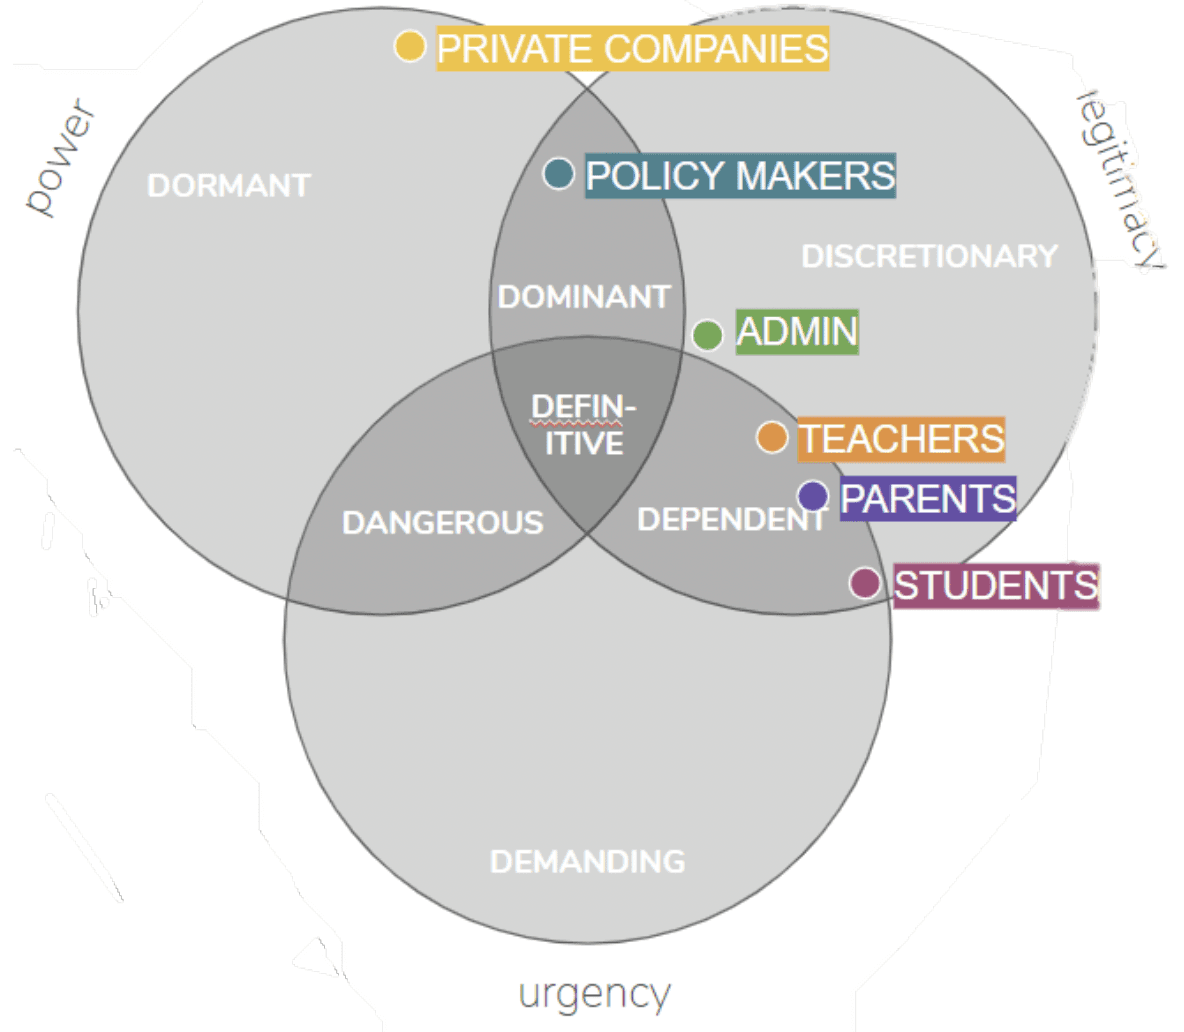
FIGURE 4.2.1
Mapping of roles of stakeholders within the system

FIGURE 4.3.1
Employee values mapped for current performance vs. relative importance.
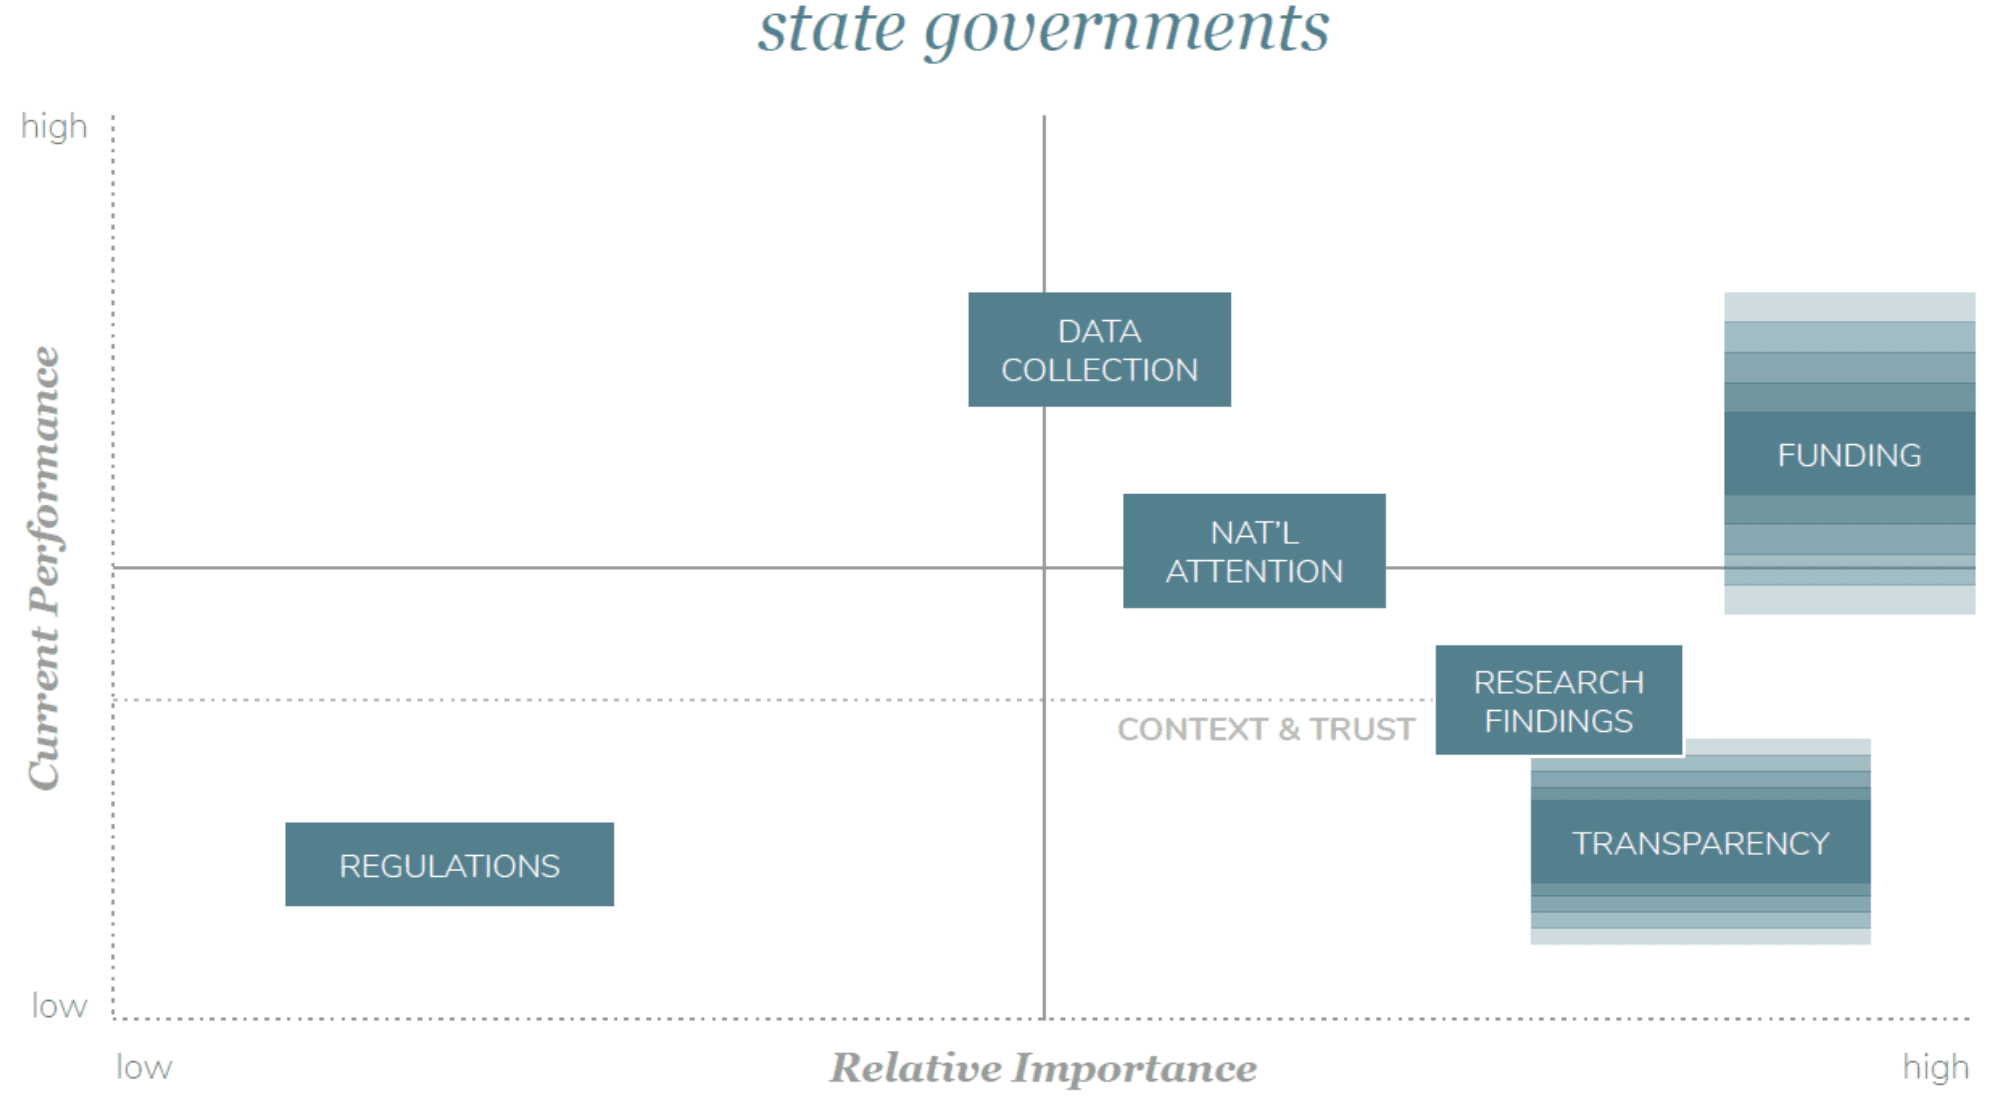
FIGURE 4.3.2
State officials’ values mapped for current performance vs. relative importance. Gradient values indicate a range of possible performance determinations, depending on the interaction with individual states, and the timing of evaluation.
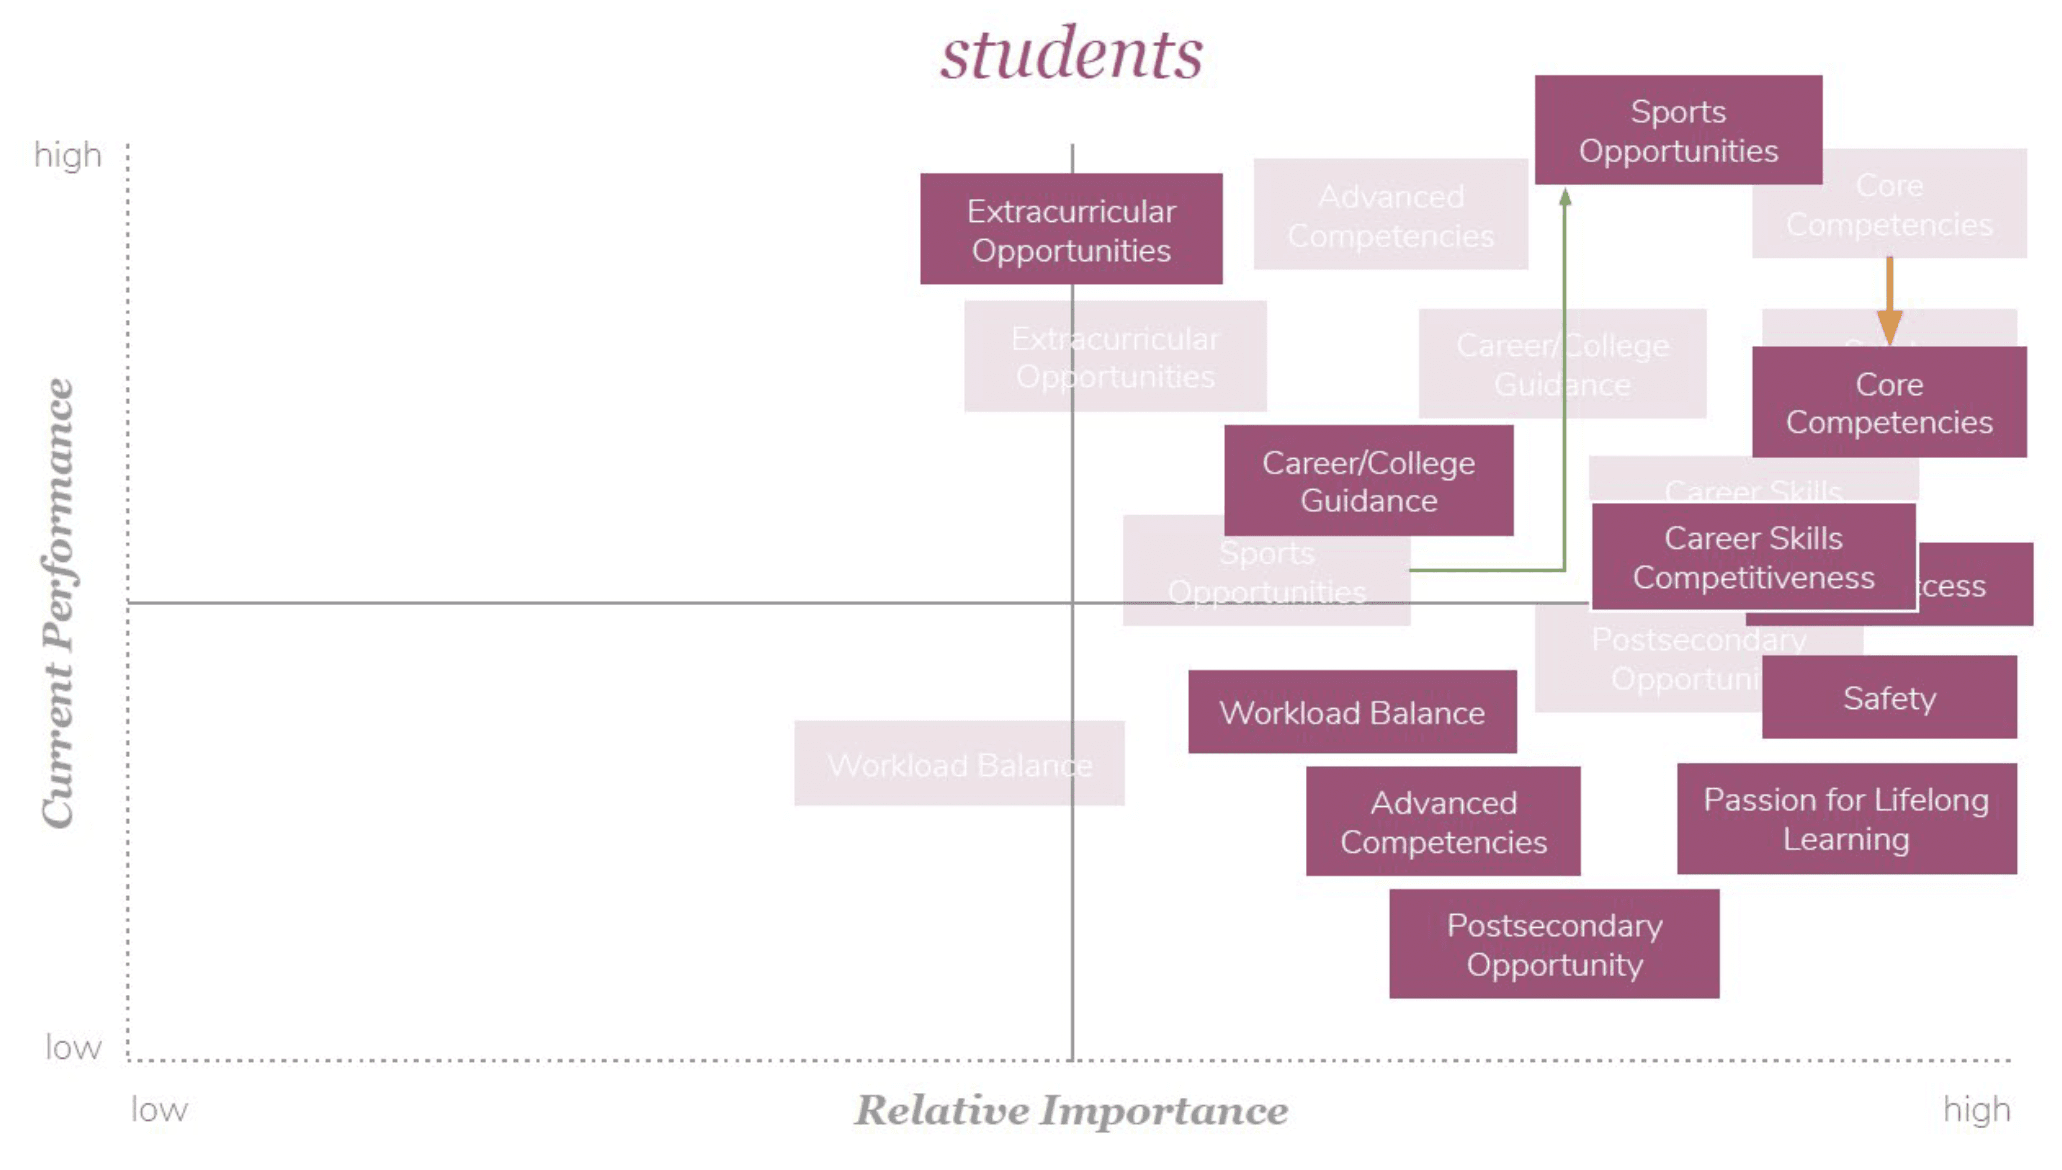
FIGURE 4.3.3
Students values mapped for current performance vs. relative importance. Gradient values indicate a range of possible performance determinations, depending on the interaction with individual states, and the timing of evaluation.
PHASE 3 👥 IDEATION AND EVALUATION
High dropout rates in rural Mississippi and inner-city Detroit stem from completely different contexts. One-size-fits-all policy can’t help—but what if these communities could learn from each other? The latent need I uncovered was not better mandates, but better mechanisms to unearth, contextualize, and sharequalitative insights between like communities—rural with rural, urban with urban, suburban with suburban.
We didn’t need a better blueprint. We needed a better workshop.

FIGURE 5.1.1
Lens analysis of a potential new enterprise architecture, chapter 5 concept generation framed in the same system elements as Table 2.2.1
FIGURE 4.3.1
US Dept of Edu Employee values mapped for current performance vs. relative importance
FIGURE 4.3.2
State officials’ values mapped for current performance vs. relative importance. Gradient values indicate a range of possible performance determinations, depending on the interaction with individual states, and the timing of evaluation.
FIGURE 4.3.3
Students values mapped for current performance vs. relative importance. Gradient values indicate a range of possible performance determinations, depending on the interaction with individual states, and the timing of evaluation.